APPLY WEATHER INFORMATION
DESCRIPTION
This unit covers the basic knowledge and skills to access and interpret meteorological data to plan outdoor activities.
OBJECTIVES
On completion of this unit, you should:
• have some background understanding of Australian weather
• have an understanding of how weather can affect paddling in your area
• be able to access forecasts and other advice from a variety of sources
• be able to make risk management decisions based on forecasts and other advice.
BACKGROUND
It has been said that the only constant thing about the Australian climate is its variability. While our modern understanding of the Southern Oscillation and El Niño may help to explain the poetic ‘droughts and flooding rains’, there is still a lot we do not know, and cannot predict.
Why do we have weather? The simple answer is that the surface of the Earth is not uniformly heated by the Sun. At a local level that leads to convection, and sea and land breezes. On a global scale, the hot tropics and cold poles lead to warm air moving aloft towards the poles, and cold air moving at the surface towards the Equator. Much of the heat is carried by water vapour, thanks to the high latent heat of vaporisation of water. But the Earth is round, and rotating, with oceans and continents, and seasonal influences, so the actual circulation is very complex. Meteorology is not an exact science.
The Australian region stretches from cool temperate in the south to tropics in the north, with much of the inland being arid, and with an alpine region in the southeast. Tasmania, being farthest south and in line with prevailing westerlies, can be very cold, wet, and windy.
In the south, the succession of Highs and Lows, with their cold fronts, is responsible for much of the weather. In the north, nominally north of 30°S, the main influences are the SE trade winds, and the monsoons. In general, places on the coast have lesser temperature ranges than places inland. They also tend to have higher rainfall, particularly if they are open to the prevailing winds: westerly in the south, easterly along the east coast
AIR MASSES
A large body of air, such as that over the Australian continent, is termed an air mass. Air masses develop characteristics according to the surface beneath them: air over the continent becomes warm and dry for example. Inland Australian air, particularly in summer, becomes very hot and dry, and is often labelled as a continental tropical air mass.
Air over the oceans to the north of Australia becomes both warm and humid. A maritime tropical air mass moving over the continent, as happens in the wet season in the north, leads to storms and heavy rain.
From over the oceans to the south come maritime polar air masses, moist but cool. It is from these air masses that the southern part of Australia receives most of its rainfall. Farther south, there are polar continental air masses over Antarctica: cold and dry. Changes of air mass bring changes in weather.
WEATHER AND CANOEING
For paddlers on inland waters, the weather has direct and indirect influences. Depending on other factors, paddling in the rain may be enjoyable, but if that rain is raising river levels to dangerous heights then the fun ceases. Other forms of precipitation, like hail and snow, are best avoided. (And of course snow melt in spring will raise the river levels.)
Extremes of temperature will influence paddling. Events like the Murray Marathon in summer mean light clothing (with adequate Sun protection), the drinking of plenty of fluids, and so on. At the other extreme, hypothermia may be a real danger, and is always better prevented than treated. The third factor is wind.
Wind is measured, and forecast, at 10 m above the surface, averaged over 10 minutes. The highest wind speeds may be as much as 40% greater than the average: something to remember in windy conditions. Wind speeds are given in knots for marine and aeronautical users, kilometres per hour for others.
River paddlers may be sheltered from some of the wind, but if the general wind direction is the same as the river valley, then wind will be funnelled along it, making paddling difficult, and also leading to wind chill.
For the paddler on open water wind is perhaps the key factor. Unless you are paddling downwind (perhaps with sail assistance) wind will slow progress, and lead to fatigue. It will certainly make the water rougher, perhaps leading to capsizes. Add wind chill, and you find paddling in wind is not the most comfortable.
INFORMATION
To describe the weather, both present and expected, various aspects can be measured: temperature, humidity, precipitation, wind, barometric pressure, and so on. That data can be represented in a number of ways, with synoptic charts perhaps being the most familiar.
SYNOPTIC CHART FEATURES
HIGH
In the southern hemisphere the circulation is anticlockwise. Barometric pressure is high. Air in the centre is descending, but is relatively calm. There may be stratus or cumulus cloud. With no cloud, or traces of cirrus, expect fine, warm weather.
LOW
Air is circulating clockwise, and air in the centre is rising. Barometric pressure is low. Cloud and showers are likely. The tropical cyclones of northern Australia are smaller, but violent versions, without fronts.
ISOBARS
Isobars join places of equal barometric pressure. As with contour lines on a topographic map, the closer the lines, the steeper the gradient. In this case the steep gradient indicates strong winds.
Winds are shown on charts with arrows, with the number of tails indicating wind strength. Precipitation is shown by shading
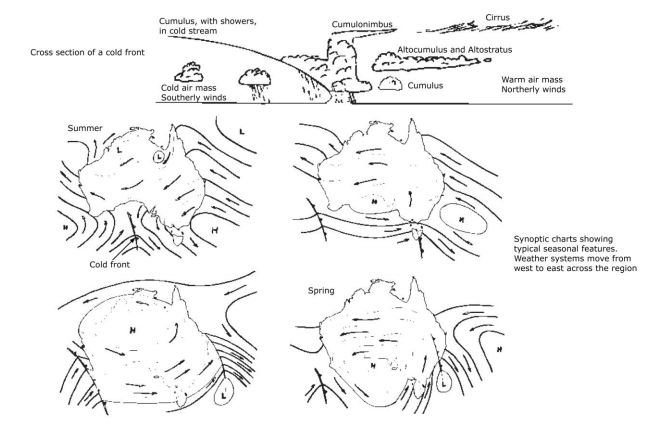
COLD FRONTS
Cold fronts are associated with low pressure systems. Ahead of the front, the wind will be northerly, conditions will be warm (or even hot, because of the overland trajectory of the air (i.e. a continental air mass)), and the barometric pressure will be falling. The cloudbase will be lowering, and there may be rain. If the front is a vigorous one, winds can be strong.
Behind the front, in the maritime air mass, the wind will be southerly (strong with a vigorous front), the air will be colder, there may be showers, and the barometric pressure will be rising. With some fronts there may be thunderstorms.
Although fronts are drawn as sharp lines, they are in fact several kilometres across: frontal zones. The four charts on the next page show typical patterns for the four seasons. Think about how they relate to your local weather.
SUMMER
Highs tend to be centred south of the continent, and may be stationary in the Tasman for several days, blocking the movement of other systems. Cold, fronts, for instance, will be slowed, and may miss the mainland. Conditions will be hot and dry over Victoria and South Australia due to the overland trajectory of the air, but the east coast may be wet in the on-shore stream. Sea breezes will be common along the coasts. Thunderstorms will be common in the north, with tropical cyclones between November and April.
AUTUMN
Highs are moving north, and winds generally become lighter
WINTER
Highs now track cross the continent, and fronts reach well inland, bringing wind and rain and showers (and snow on the highlands). Southern parts of the continent receive their greatest rainfall, and snowfall in alpine areas. The generally offshore winds in the north mean that weather is generally dry.
SPRING
Highs are moving south, but fronts and lows still bring wind and precipitation. Remember that synoptic charts will not show local weather like sea breezes
OTHER INFORMATION
Satellite images, visible and infra-red, are often interesting to look at, but they do require interpretation. Other data available from the Bureau includes maximum and minimum temperatures, rain and snowfall, barometric pressure and prevailing winds. Seasonal aspects of these will direct your planning of expeditions.
FORECASTS
Based on the information from observers, automatic stations, satellites and so on, forecasters develop computer models of the weather, and with them, make their forecasts. Those forecasts are made available through the Bureau’s Web site and through the media: radio, television, and newspapers. Forecasts are generally reliable for about three days.
The standards of presentation have improved in recent years, but you still need to interpret forecasts for your own area and activity. How will the forecast weather affect river level, sea state, your own comfort? How will it affect alternate landing sites and escape routes?
Pay particular heed to warnings, in fact take the pessimistic view, and if in doubt, don’t. You do not, for instance, want to be paddling under a thunderstorm. Quite apart from the obvious danger of lighting strikes, there can be very heavy showers and very strong downdrafts. Strong Wind Warnings are issued if the wind is likely to exceed 25 kn (46 km/h), Gale Warnings for winds faster than 34 kn (63 km/h). Other warnings are issued for heavy rain and hail, storm, cyclone, and blizzard.
Other sources of information may be National Park rangers, who will have an understanding of how the weather affects their area, and its river levels and access. Other local people, especially those who work outdoors, can usually offer similar advice. Motoring organisations will be able to help with information about road conditions, and the ways they may be affected by heavy rain. Sea paddlers will find professional fishermen have an intimate knowledge of the weather in their area. Sea paddlers will also need to consider tides.
CONCLUSION
Nothing beats experience. Look at the forecasts, and relate them to what you see on the water. Play safe, and paddle within your limitations.
ACKNOWLEDGEMENT
This module was written and illustrated by Peter Carter, with additional material by Ian Dewey.
FURTHER READING
FURTHER READING Australian Geographic, The Australian Geographic Weather Journal, Australian Geographic, 1999
Bureau of Meteorology, Climate of , Bureau of Meteorology, 1991 – 1998 Colls, K and Whitaker, R,
The Australian Weather Book, New Holland Publishers, 2001 Burroughs, W, et al,
An Australian Geographic Guide to Weather, Australian Geographic, 1999
Crowder, R, The Wonders of the Weather, Bureau of Meteorology, 2000 Haddock, C, Managing Risks in Outdoor Activities, New Zealand Mountain Safety Council, 1993
APPENDIX: INTERPRETING FORECASTS
COASTAL WATERS FORECASTS
Following is a typical coastal waters forecast with comments on the details of each part. Date and time of issue Issued at 1555 hours on Wednesday the 18th of September 2002 For the period till midnight on Thursday Ensure the forecast is relevant to your trip. Even future predictions are valid for around three days only.
PLEASE BE AWARE
Wind gusts may be a further 40 per cent stronger than the averages given here, and maximum waves may be up to twice the height. This warning is pertinent to all paddlers, especially sea kayakers: the forecast may be 1.5 m swells with winds to 20 knots, but if you are going to go out in it, you must be able to handle 3 m swells and 28 knot winds.
SITUATION
This is a general section giving you an overview of what you will see on the synoptic chart A cold front through Bass Strait, expected to reach the south NSW coast this evening, reaching the Hunter later Thursday.
The weather is about to change, it will get cooler and probably windier, starting at the border this evening and reaching to north of Sydney by late Thursday. If your activities are in exposed areas in the next 24 hours, you have wind and possibly rain coming.
WARNINGS
This is a section that needs careful attention: is something about to happen in your area? A Storm Warning is current for waters south of Green Cape. A Gale warning is current for waters Seal Rocks to Green Cape. A Strong Wind Warning is current for waters Seal Rocks to Port Macquarie
WEATHER
The weather section tells you whether it will be wet or dry. ‘Rain’ is steady and normally falls from stratiform (layer) cloud, ‘showers’ are short-lived and fall from convective cloud.
A few showers in the south.
If we are in southern NSW, we should plan for periods with showers.
FAR NORTH COASTAL WATERS:
There is one of these for each area of the coast: find the relevant map of the areas for your state. Qld – NSW border to Wooli and 60nm seawards
The defined area W’ly wind 20/25 knots. S/SW wind 20/25 knots Thursday,
tending S’ly 15/20 knots later. The expected wind strength and direction. Remember it can be 40% stronger
Sea 1.5 to 2 metres. Swell 1.5 to 2 metres.
‘Sea’ is the waves caused by the local winds, ‘swell’ are the waves caused by distant conditions, the two act with each other, so that you can get areas of flat and areas of large combined waves. Outlook for Friday
The future. Remember that accuracy decreases as you forecast farther into the future S/SE wind 10/15 knots, afternoon E/NE seabreezes 10/15 knots
STANDARD DISTRICT (INLAND) FORECAST
NORTH EAST DISTRICTS FORECAST
BUREAU OF METEOROLOGY NEW SOUTH WALES REGIONAL OFFICE
Issued at 1603 hours on Wednesday the 18th of September 2002 For the period through to Sunday
Make sure the forecast is relevant to you.
NORTHERN RIVERS
Tonight Very High fire danger. Dry. Moderate to fresh westerly winds. A warning not to light any type of fire and to be aware of smoke to your west. Note also, the words ‘moderate’ and ‘fresh’ have specific definitions, which can be read from the Beaufort scale below.
APPENDIX: WIND AND WAVE
SEA AND SWELL
SEA [IN OPEN SEA]


